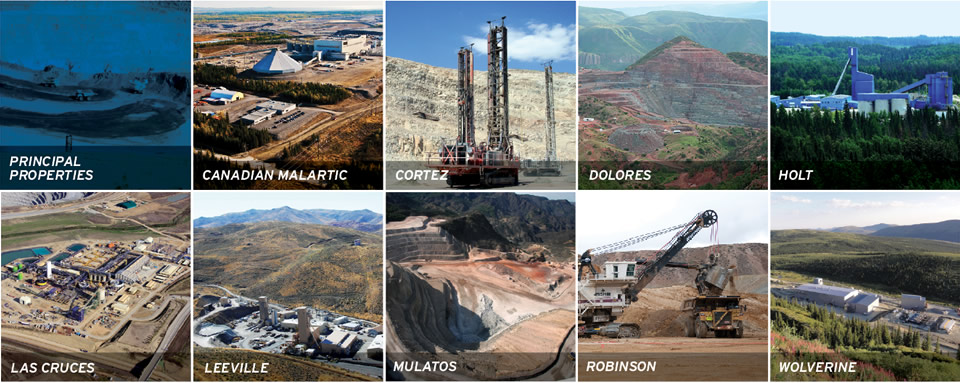
Principal Properties2012 Interactive Annual Report
Our fiscal 2012 principal properties were determined by historical and future potential revenues, upon consideration of reserves, production estimates and mine lives
| Property | Operator | Revenue | Royalty | Production 1 | Reserves 2 |
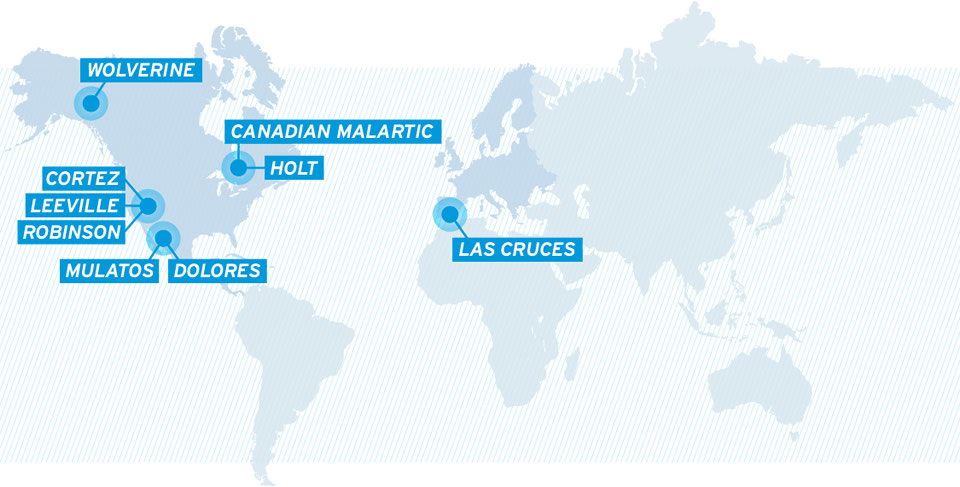
HoltCanada, Ontario |
St Andrew Goldfields |
$15.0M |
0.00013 x average monthly gold price - NSR (sliding-scale) | 41,166 oz. gold | 0.4M oz. gold |
Mulatos 3Mexico, Sonora |
Alamos |
$13.8M |
1.0% to 5.0% NSR (sliding-scale) | 169,268 oz. gold | 2.4M oz. gold |
CortezUnited States, Nevada |
Barrick |
$13.2M |
0.40% to 5.0% GSR1 & GSR2 (sliding-scale); 0.71% GSR3; 0.39% NVR1 |
116,672 oz. gold | 5.5M oz. gold |
RobinsonUnited States, Nevada |
KGHM |
$11.7M |
3.0% NSR | 31,029 oz. gold 105.3M lbs. copper |
0.8M oz. gold 1.3B lbs. copper |
LeevilleUnited States, Nevada |
Newmont |
$9.2M |
1.8% NSR | 305,059 oz. gold | 0.9M oz. gold |
Canadian MalarticCanada, Quebec |
Osisko |
$7.1M |
1.0% to 1.5% NSR (sliding-scale) | 297,545 oz. gold | 4.8M oz. gold |
Las CrucesSpain, Andalucía |
Inmet |
$6.4M |
1.5% NSR | 119.1M lbs. copper | 1.8B lbs. copper |
DoloresMexico, Chihuahua |
Pan American Silver |
$5.3M |
3.25% NSR (gold); 2.0% NSR (silver) |
61,203 oz. gold 105.5M oz. silver |
1.8M oz. gold 105.5M oz. silver |
WolverineCanada, Yukon Territory |
Yukon Zinc |
$2.2M |
0.0% to 9.445% NSR (sliding-scale) | 1,296 oz. gold 1.0M oz. silver |
0.2M oz. gold 39.5M oz. silver |
- Reported production relates to the amount of metal sales that are subject to our royalty interests for the fiscal year ended June 30, 2012, as reported to us by the
operators of the mines.
- Reserves have been reported by the operators as of December 31, 2011.
- See footnote 8 related to the producing properties table.